Ichor for Talos Linux and Kubernetes
1.21 Security keys, an audit log, Argo CD diffs and CAST AI →

Every cluster you run, from your phone.

Ichor was built for Talos Linux and still speaks to it with the same client as talosctl. Today it also opens any kubeconfig: EKS, GKE, AKS, DigitalOcean, Rancher, Sidero Omni or an OIDC sign-in, with nothing to install on the cluster and nothing in between.

No cluster at hand? Tap Try demo on the first screen: five sample nodes, live graphs and logs, fully offline. Free and open source, Apache-2.0, read-only by default.

Born on Talos · At home anywhere

It started as a Talos app. Now it opens any kubeconfig.

Drop a kubeconfig in, by file, paste, QR or the share sheet. The preview lists every context with how it signs in and adds the ones you pick. Each cluster gets a Kubernetes home, every Kubernetes screen, background alerts and a colour of its own, so a restart is never aimed at the wrong one.

  • Talos Linux

    A talosconfig, with the roles baked into its certificate: node health, logs, etcd, KubeSpan, upgrades, the Talos API end to end.

  • Sidero Omni

    Sign in to the instance as omnictl does, pick the clusters it lists. Omni's role for your identity is what the app may do.

  • Managed Kubernetes

    EKS, GKE, AKS, DigitalOcean and Rancher: list the clusters of the account and add them, or import the kubeconfig the CLI wrote. Exec plugins are replaced by a sign-in on the phone.

  • Anything else

    A client certificate, a ServiceAccount token, or OIDC with kubelogin, in the browser or with a device code. k3s, RKE2, kubeadm, OpenShift: if kubectl reaches it, so does Ichor.

Signed in like your laptop, sealed like a key

No aws, gcloud or az binary runs on the phone: Ichor does what the exec plugin would, with a sign-in that stays on the device and renews itself. Tokens and keys are sealed in StrongBox or the Secure Enclave, behind the app lock.

"Which account is this cluster using?" → shown on its home.

  • Talos Linux
  • Sidero Omni
  • Amazon EKS
  • Google GKE
  • Azure AKS
  • DigitalOcean
  • Rancher
  • OIDC · kubelogin
  • Client certificate
  • ServiceAccount token
  • Argo CD
  • Flux
  • Cilium · Calico
  • CAST AI

On a cloud cluster the Kubernetes home also says where the cloud put each node: its Karpenter pool, managed node group, compute class or agent pool, the machine type, and whether it is spot or on-demand. A Talos cluster can use one of these identities for its Kubernetes screens too, instead of the admin kubeconfig.

New in 1.18 to 1.21

Every change on record, every action checked first.

Four releases of operating, not only watching: a security key to unlock the app, an encrypted log of what the app changed and who tapped it, the diff Argo CD would apply, a PromQL assistant on the metrics screen, CAST AI's savings on both platforms, and Kubernetes actions that know in advance whether your account may run them.

An audit log of what the phone did

Every cluster change made from the app, reboot, restart, sync, rollback, delete, is recorded with its outcome, even when a background run crashes, in a log encrypted on the device. The Activity screen reads it on Android and iOS.

"Who restarted grafana at 2 pm?" → this phone, from this screen.

Argo CD: see the diff, then sync

Show diff renders what a sync would change, object by object, from the comparison the controller already made, Secret values hidden. The revision, each history entry and a running sync link to their commit on GitHub, GitLab, Gitea, Forgejo, Codeberg or Bitbucket. Rolling back now asks you to type the app's name.

"What does this sync touch?" → the three objects, before you tap.

Unlock with a security key

A YubiKey or any FIDO2 key, over NFC or USB, can replace the PIN and biometrics for the app lock, and seal the stored configs so that nothing reads them without the key, not even a copy of the phone's storage.

"Phone lost?" → the configs are sealed to a key that is not in it.

A PromQL assistant on the Metrics screen

Say what you want to see; the assistant writes the query, runs it against your Prometheus to check it returns something, and adds the panel. Optional, off by default, with your own Claude or OpenAI key, on Android and iOS.

"Memory of every pod on w-2, stacked" → a panel, checked.

CAST AI on both platforms

Workload recommendations with the money they save, node consolidation plans and what a failed plan left behind as missed savings, in a redesigned workloads view, now on iOS as well as Android.

"What is over-provisioned?" → ranked, with the saving.

Any object, summarised, with what you may do

Every object now has a summary tab, like the top of kubectl describe: conditions, owners, the events of the last hour. Its actions are one tap away, and the ones your account may not run are disabled with the reason, asked from the API server before you try.

"Can I restart this from here?" → yes, or why not.

  • Alerts on every cluster

    Background alerts, data services and the arrangeable home now work on clusters added from a kubeconfig, not only Talos ones.

  • Alerts that open the right screen

    Tap a notification and land on the node, pod or backup it is about, with one Android channel per kind to mute what you want.

  • Typed confirmations

    Deleting every cluster or rolling back an Argo CD app asks you to type its name. One-tap actions sit where their object is.

  • Same settings, both platforms

    Android and iOS share one settings layout, say where updates come from, and pass an accessibility check with readable dense text.

Network, storage and pressure

Is it the network, the storage or the node? Measure it.

Something is slow and every node says Ready. Ichor measures the link between two nodes, checks the storage and databases your apps sit on, and shows which workload a node is starving, straight from the phone.

Network test

Pick two nodes, from a list or, on Android, right on the cluster map, and Ichor measures them with netperf, the way cilium connectivity perf does, on any CNI: TCP throughput, then p50, p90 and p99 latency, pod to pod and, if you want, host to host. Results are kept and charted over time.

"Is the new switch any faster?" → measured.

Data services

Ichor recognises Longhorn, CloudNativePG, Garage and Dragonfly in the cluster and checks them: degraded volumes and their replicas, Postgres instances and stale or failed backups, Garage nodes, Dragonfly's master and replicas. Each problem names the node behind it, and opt-in alerts tell you when a volume faults or backups stop.

"Did last night's backup run?" → yes, or why not.

Argo CD

When Argo CD runs in the cluster, Ichor lists its applications with their health and sync state, follows a sync wave by wave, and lets you sync, refresh, terminate a sync, pause auto-sync or roll back. It talks to the Application resources with the admin kubeconfig Talos issues: no Argo CD token, and an app an ApplicationSet manages is never changed behind its back.

An app Ichor does not recognise, such as a personal project, can bring its own logo with the ichor.levis.name/icon annotation: a Dashboard Icons name, an https link to a PNG or WebP (downloaded only when you allow icon downloads) or the image itself, inline in base64.

kubectl -n argocd annotate application my-site \
  ichor.levis.name/icon=https://example.org/logo.png

"Why is this app degraded?" → the pod and the node.

Node pressure and cgroups

How long work on a node waits for CPU, memory or disk, charted over the last five minutes, with the workload that waits the most, OOM kills and containers close to their memory limit. The Cgroups tab, like talosctl cgroups, breaks it all down by service, pod and container.

"Who is eating w-2?" → named.

These need an os:admin certificate. The network test runs its pods in a namespace of its own, with the restricted pod security profile, and deletes it afterwards; each measurement fills the link for 5 to 20 seconds. Saved results stay encrypted on the phone, out of backups, and data service alerts are off until you turn them on.

  • Cluster map

    On Android, the KubeSpan screen draws your sites, nodes and tunnels, up, degraded or down, with a flag for each zone. Tap two nodes to test the link between them.

  • Open an app in the browser

    An app's sheet lists its web addresses, found in the Ingresses and Gateway API HTTPRoutes that point at it, one tap away.

  • Finds your cluster on the LAN

    No endpoint answers from here? On Android, Ichor searches the local network for nodes that accept your credentials, and lets you edit endpoints by hand.

  • Ready-made debug commands

    About 40 netshoot commands for DNS, MTU, TLS, KubeSpan and more, one tap away in the debug shell, so you barely need the phone keyboard.

Apps and Kubernetes

Know what runs on your cluster, and nudge it when it sticks.

Talos tells you the nodes are fine. But is Grafana up to date, why is one Cilium agent still on the old version, and which pod is crash-looping? Ichor now shows the software running in the cluster, and, with an admin certificate, restarts the workload or deletes the stuck pod without a laptop.

App inventory

Every container on every node, grouped into the apps you recognise, with their logos: Home Assistant, Immich, the *arr stack, Longhorn, Cilium and about 250 more. Sidecars and init containers join their app, and Ichor flags an app running two versions at once or an unpinned :latest image.

"Is everything on the new version?" → one glance.

Workloads and rollout restart

Deployments, StatefulSets and DaemonSets with their readiness and rollout state, the ones that need attention first. Restart one with a rolling update, like kubectl rollout restart, after a confirmation that warns when it runs a single pod. The rollout then shows live, old and new pods, until every new pod is ready; close it any time, the rollout goes on.

"It just needs a kick." → kicked, from bed.

Pods, unhealthy first

Every pod with the status kubectl get pods shows (CrashLoopBackOff, Init:Error, Terminating), its restarts and node. Delete a stuck one so its controller starts a fresh copy; the confirmation tells you whether anything brings it back.

"Why is it still restarting?" → gone, recreated.

CronJobs, run on demand

Every CronJob with its schedule, next run and how its last runs went, the failed and running ones first. Run one now, like kubectl create job --from, after a confirmation: the Job stays owned by its CronJob, so history and cleanup still apply.

Give each one a logo, a name and a line of description with a label or an annotation; without an icon, Ichor picks the one of the app its image belongs to, else a clock. Set ichor.levis.name/trigger=false to keep a job on its schedule only.

kubectl label cronjob db-backup ichor.levis.name/icon=postgresql
kubectl annotate cronjob db-backup ichor.levis.name/title="Database backup"
kubectl annotate cronjob db-backup ichor.levis.name/description="Nightly dump to S3"
kubectl label cronjob wipe-staging ichor.levis.name/trigger=false

"The backup failed last night." → re-run, from the couch.

The app inventory works with a read-only os:reader certificate and the logos ship inside the app, so nothing is looked up online. Workloads and pods use the admin kubeconfig Talos issues, kept in memory only. Screenshot mode hides every logo as well as addresses and node names.

  • "Can't reach the cluster", explained

    VPN off or on the wrong network? Instead of a wall of red nodes, one notice says why, retries on its own and recovers the moment your connection comes back.

  • Evidence with every incident

    Recorded incidents now keep the service states and network link changes captured at the time, with technical details one tap away.

  • Logos for the rest, if you want

    For apps beyond the 250 bundled ones, Ichor can download a logo from the open Dashboard Icons set. It is off by default and sends only the icon's public name.

  • Version drift, spotted

    One node still on the old Cilium, a forgotten :latest tag: apps that need a look are counted right on the overview.

Cluster insights

Stop guessing what changed. Your phone saw it.

It's 3 a.m., a node is flapping and your laptop is in the other room. Cluster insights turns Ichor from a status page into a troubleshooting kit: spot the node that drifted, record the incident as it unfolds, and see which resource is actually choking. All with a read-only os:reader certificate.

Configuration drift

The one worker with a different MTU, the forgotten NTP server, the extension left behind on an upgrade. Ichor compares DNS, NTP, MTUs, extension versions, Secure Boot, UKI and Talos versions across each role, or against a baseline you save, and points at the odd one out.

"Why is only w-3 slow?" → found it.

Incident recorder

Hit record while it's happening and Ichor builds a timeline for up to ten minutes: live Talos events, plus node readiness, services, links and network counters sampled every five seconds. The timeline is saved, ready for the postmortem.

"What broke first?" → it's on the timeline.

Bottleneck metrics

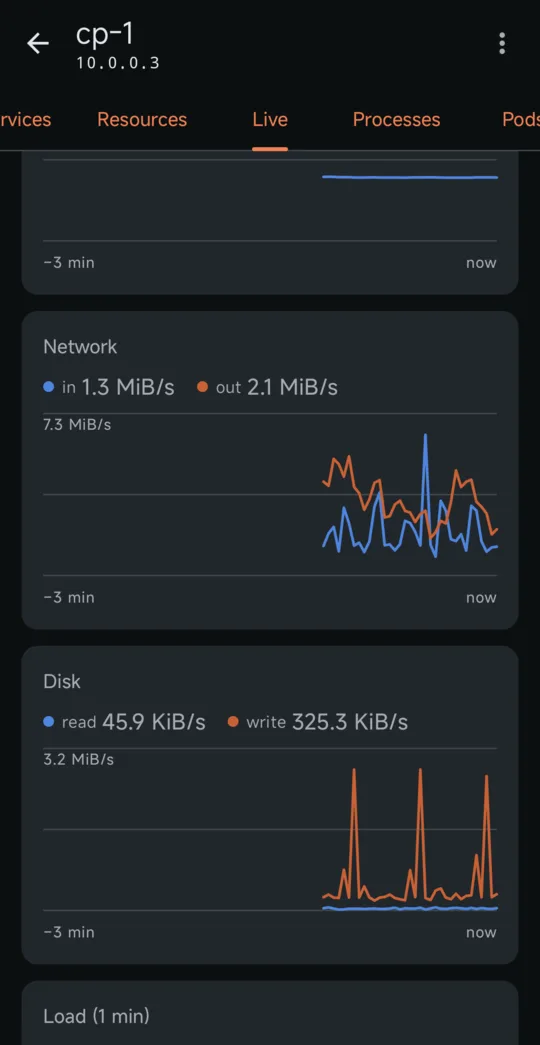
High load, but is it the CPU, the disk, the network or a noisy neighbour on the hypervisor? The Live tab now shows I/O wait and VM steal time, per-disk throughput and I/O time, and per-interface throughput, errors and drops, with no fake spikes after a reboot.

"Is it the disk?" → now you know.

Baselines and recordings are encrypted on the phone, kept apart per cluster and never backed up. No machine configs, kubeconfigs or raw logs are collected, and you can delete everything from the insights screen.

  • Finds the nodes you forgot

    Your talosconfig lists one endpoint? Ichor asks the cluster for its members and offers to add the missing nodes in one tap.

  • Wake-on-LAN

    Wake a powered-off node from its action sheet. Ichor remembers each node's network cards while it is up, so you can wake it even if you never set it up.

  • Try it with no cluster

    The built-in demo runs offline with five sample nodes, live metrics, logs, etcd and more. See everything before you import a single config.

  • Safer imports, faster switching

    Importing a context with a familiar name never overwrites a cluster. Long-press the app icon to jump straight into any cluster.

What it looks like

Real screens from a running cluster, taken in screenshot mode: addresses and node names are replaced with stand-ins.

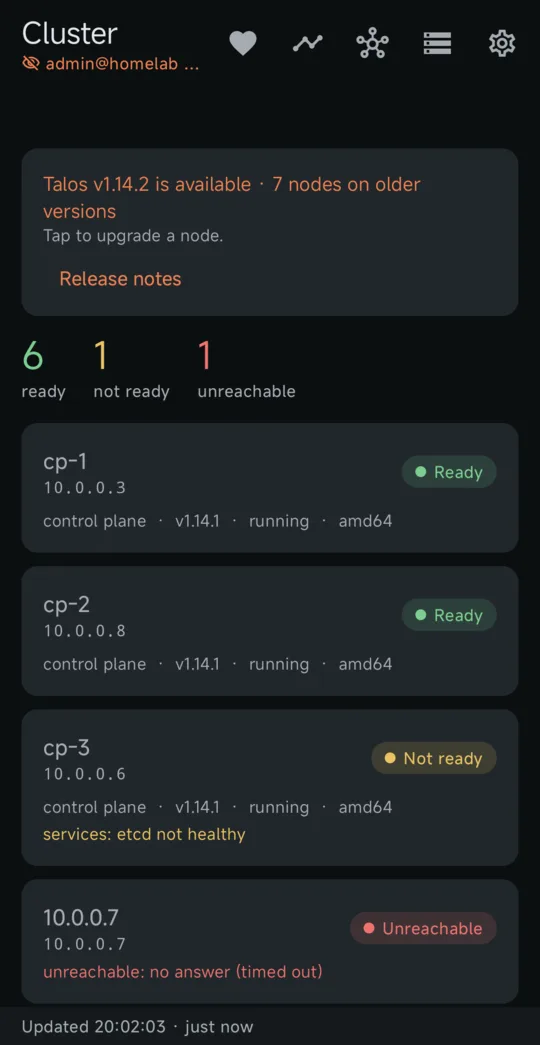
Cluster overview screen of Ichor for Talos Linux
Cluster overviewEvery node at a glance, and a banner when a newer Talos is out.
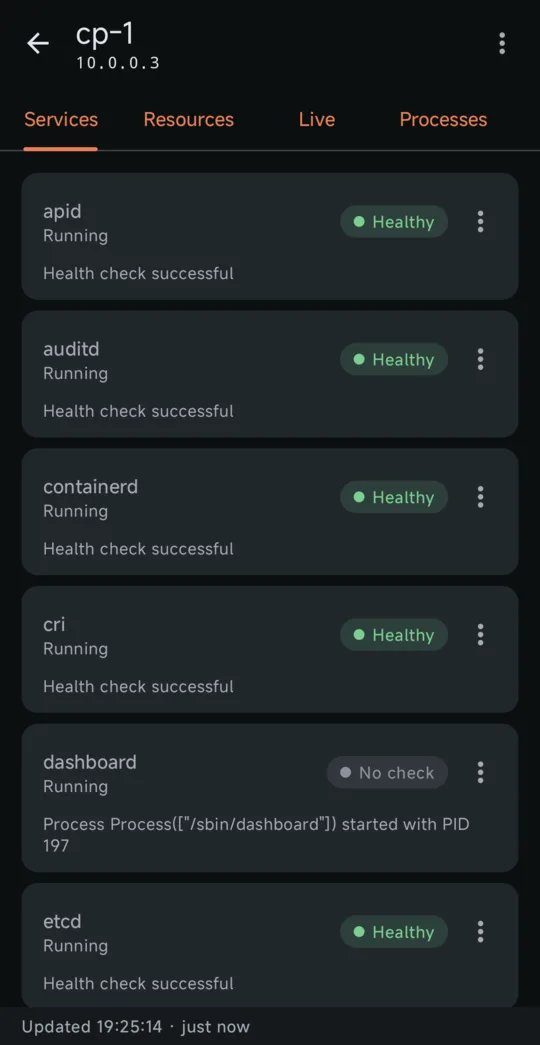
Services screen of Ichor for Talos Linux
ServicesHealth of each Talos service, with restart for operators.
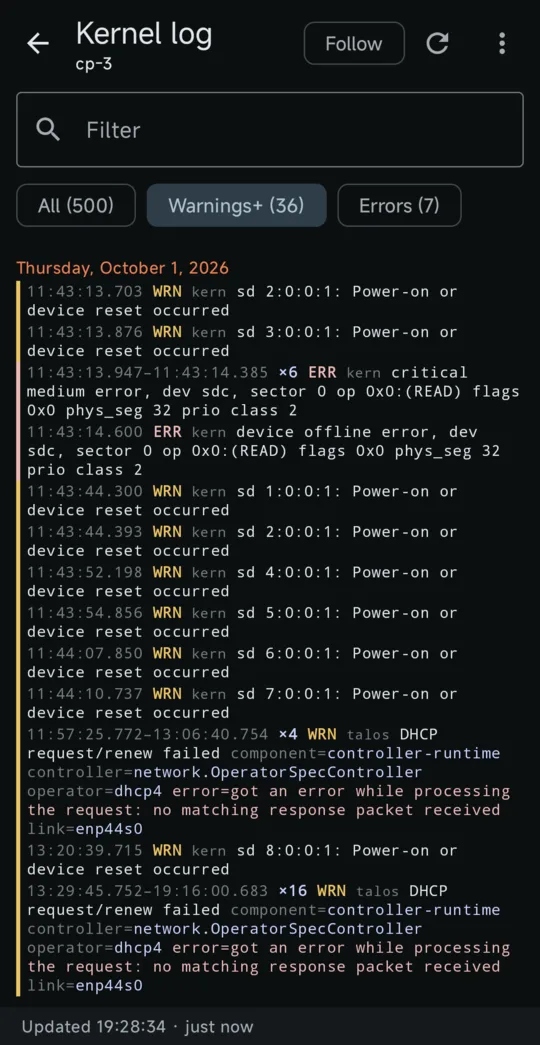
Kernel and service logs screen of Ichor for Talos Linux
Kernel and service logsColored by level, repeats folded, filter to warnings or errors.
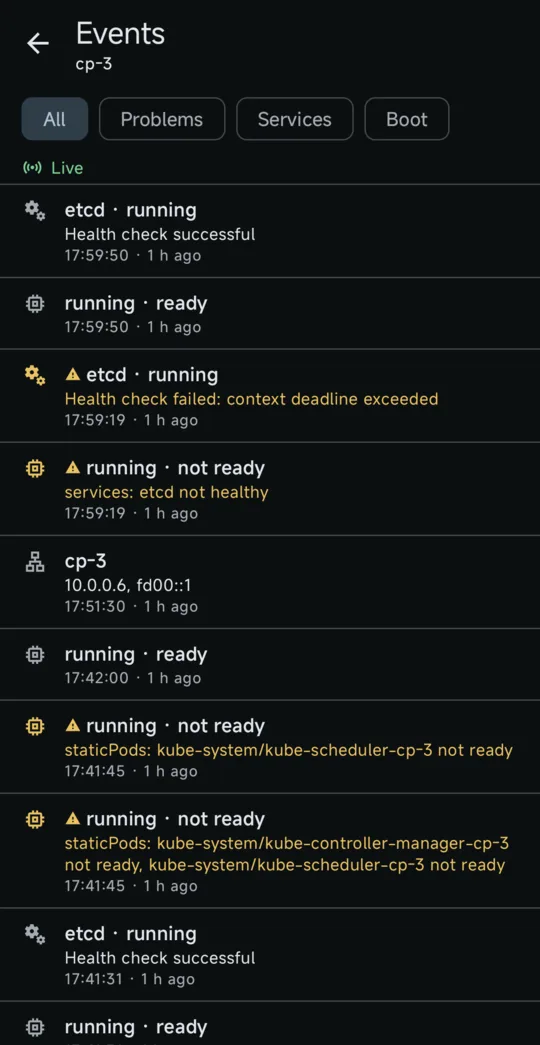
Events screen of Ichor for Talos Linux
EventsService changes and node conditions as they happen.
Live graphs screen of Ichor for Talos Linux
Live graphsCPU, memory, network, disk and load every two seconds.
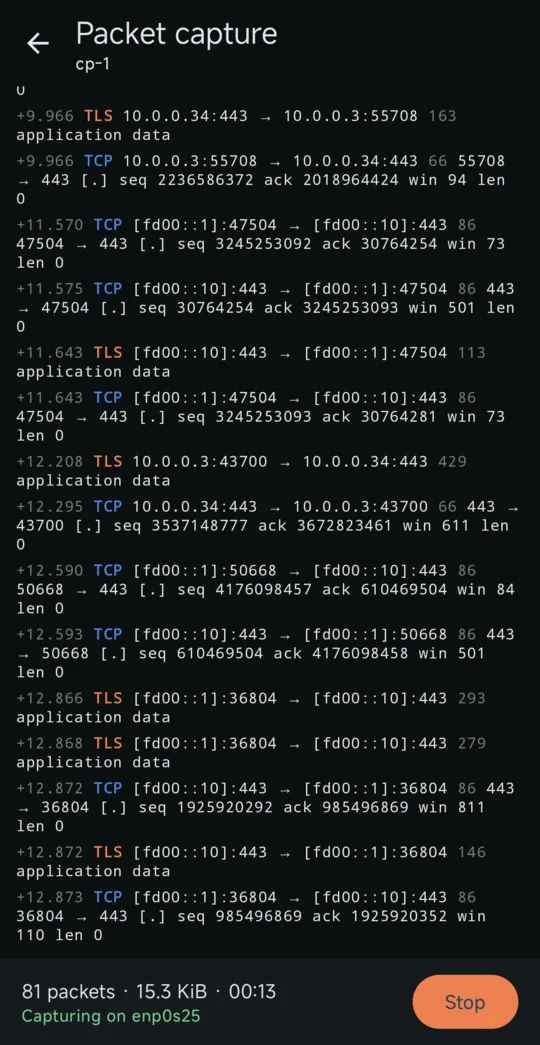
Packet capture screen of Ichor for Talos Linux
Packet captureA live packet list, saved as a .pcap for Wireshark.
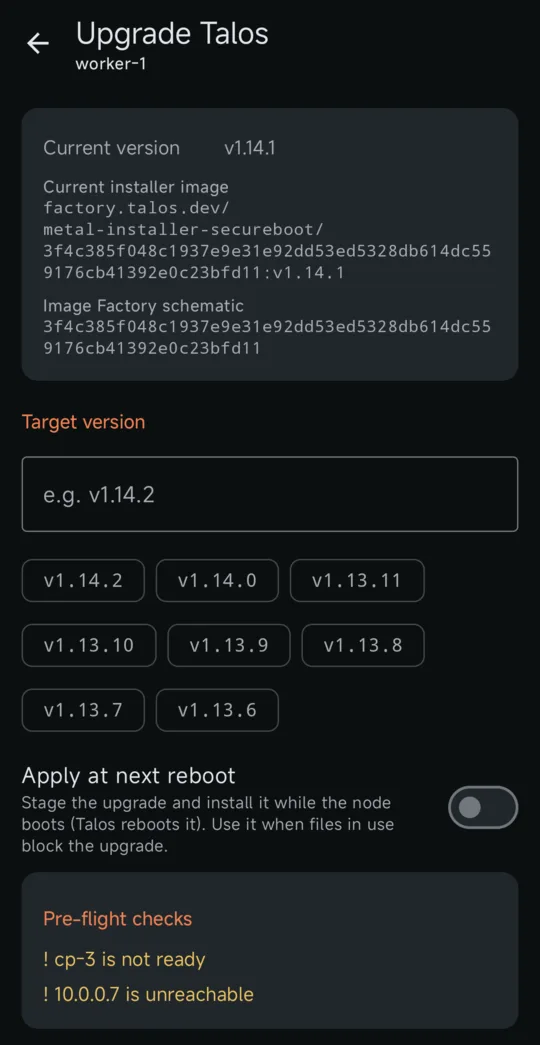
Talos upgrade screen of Ichor for Talos Linux
Talos upgradeYour installer image with the new version, after pre-flight checks.

The talosctl commands you reach for, as screens

Everything runs through the official Talos Go client, so talosconfig contexts, mTLS and endpoint-to-node proxying behave exactly like talosctl.

Instead of Open Role
talosctl get machinestatus Cluster overviewEvery node: ready, not ready or unreachable, with the unmet conditions, clock drift and available Talos upgrades. reader
talosctl services, talosctl logs -f Services and logsService health, and service or kernel logs colored by level, with repeats folded and a live follow mode. reader
talosctl events Events timelineService changes, boot phases and address changes across the cluster, as they happen. reader
talosctl dashboard, talosctl processes Live graphs and processesCPU, memory, network, disk and load every two seconds, and the process list sorted by CPU or memory. reader
talosctl get members Node discoveryCluster members your talosconfig does not target yet, added to the context in one tap, and, on Android, a search of the local network when no endpoint answers. reader
diff of talosctl get … on every node Configuration driftDNS, NTP, MTUs, extensions, Secure Boot, UKI and Talos versions compared across a role or against a saved baseline. reader
talosctl events + watch, in a terminal Incident recorderEvents and sampled node, service and network state merged into one saved timeline. reader
talosctl read /proc/stat, /proc/diskstats Bottleneck metricsI/O wait, steal time, per-disk I/O and per-interface errors and drops, live. reader
talosctl containers -k PodsContainers grouped by pod, with CPU and memory. reader
talosctl containers -k on every node App inventoryThe software running in the cluster, grouped into apps with their logos, versions, version drift and unpinned images. reader
talosctl get links, talosctl netstat NetworkInterfaces, addresses, routes, DNS and time servers, and open connections. reader
talosctl apply-config --mode try Machine configThe node's configuration field by field or as YAML, secrets hidden unless you reveal them. Edit it and try the change: the node goes back by itself unless you keep it. admin
talosctl etcd status, etcd snapshot etcdMembers, leader, size and alarms, defragmentation, and a snapshot saved to the phone. reader / backup
talosctl get kubespanpeerstatuses KubeSpanEach node's peers: state, endpoint, last handshake and traffic, and, on Android, a map of sites, nodes and tunnels. reader
talosctl service restart Service controlStart, stop or restart a service, with a warning for critical ones. operator
talosctl reboot -m powercycle Reboot, shutdown and wakeGraceful, power cycle or force, after you type the hostname to confirm. Wake a powered-off node with Wake-on-LAN. operator
talosctl pcap Packet captureA live packet list with decoded details, saved as a .pcap to open in Wireshark. operator
talosctl upgrade Talos upgradeOne node at a time, refused if etcd would lose quorum, with progress until the node is back. admin
kubectl get deploy,sts,ds, kubectl rollout restart Kubernetes workloadsReadiness and rollout state of every Deployment, StatefulSet and DaemonSet, and a rolling restart after a confirmation. admin
kubectl get cronjobs, kubectl create job --from Kubernetes CronJobsSchedule, next run and recent runs of every CronJob, with the icon and name you give it, and a manual run after a confirmation. admin
kubectl get pods, kubectl delete pod Kubernetes podsPod status, readiness, restarts and node, unhealthy first; delete a stuck pod so its controller recreates it. admin
cilium connectivity perf, netperf Network testTCP throughput and p50 to p99 latency between two nodes, pod to pod or host to host, saved and charted over time. admin
kubectl get volumes.longhorn.io, clusters.postgresql.cnpg.io Data servicesLonghorn volumes, CloudNativePG clusters and their backups, Garage and Dragonfly, with the node behind each problem. admin
talosctl cgroups Node pressure and cgroupsCPU, memory and disk pressure, the workload that waits the most, OOM kills, and usage per service, pod and container. admin
talosctl config new Issue a talosconfigRenew this phone's certificate, or create a read-only one for another device as a QR code. admin
talosctl health Cluster health checkThe server-side checks, streamed as they run. admin
talosctl debug Debug shellRun an image such as nicolaka/netshoot on a node and get a terminal, with about 40 ready-made commands. admin

Your phone gets only the access you give it

Generate a dedicated talosconfig for the phone. The app reads its roles and only shows what that certificate is allowed to do. If the phone is lost, the certificate grants nothing more, and it expires on its own.

Operator

os:operator

Everything read-only, plus reboot, shutdown, service restarts and packet capture.

Admin

os:admin

Adds the health check, machine config, Talos upgrades, issuing talosconfigs, kubeconfig export, debug shells, Kubernetes rollout restarts and pod deletes, network tests, data services and node pressure.

The talosconfig is encrypted with a key held in the phone's security chip: StrongBox or the TEE on Android, the Secure Enclave on iPhone. An optional fingerprint, Face ID or PIN lock guards the app and every reboot.

Install

  1. Create a talosconfig for the phone

    On your workstation, sign a read-only certificate on one control-plane node, then list your nodes.

    talosctl -n <control-plane-ip> config new talosconfig-phone --roles os:reader --crt-ttl 8760h
    talosctl --talosconfig talosconfig-phone config node <node-1> <node-2> …
  2. Install the app

    On Android, add it to Obtainium to get updates, or download the APK for your phone (arm64-v8a for almost all of them) from the latest release.

  3. Import the config

    Pick the file, paste it, or scan it as a QR code:

    qrencode -t ansiutf8 -r talosconfig-phone

    Too large for one QR code? Compress it, the app expands it:

    gzip -9 < talosconfig-phone | qrencode -8 -t ansiutf8

Android

Android 8 and later, one APK per ABI. The app checks GitHub releases for updates and verifies each download's checksum and signing key before installing.

Latest release

iPhone

iOS 17 and later. Each release includes an unsigned IPA: install it with Sideloadly or AltStore, which sign it with your Apple ID.

Latest release

Why Ichor

One vein kept the bronze giant alive. Keep an eye on yours.

In Greek myth, Talos was the bronze giant who guarded Crete, walking its shores three times a day. A single vein ran from his neck to his ankle, carrying ichor, the golden blood of the gods. As long as the ichor flowed, Talos stood.

Your cluster has a pulse too: nodes ready, services healthy, etcd with a quorum. Ichor is the app you open to check it, from anywhere, and the one that taps you on the shoulder when it falters.

Questions

Can I try it without a Talos cluster?

Yes. Tap Try demo on the import screen: an offline cluster of five sample nodes with live metrics, services, logs, events, etcd and networking. It is clearly marked as demo data, can sit next to your real clusters, and is removed from Manage clusters.

Does it work without Talos, on EKS, GKE or AKS?

Yes. Add a cluster from a kubeconfig, or list the clusters of an AWS, Google Cloud, Azure, DigitalOcean or Rancher account and add the ones you pick. The sign-in the kubeconfig's exec plugin would run happens on the phone instead: IAM Identity Center, Entra ID, a service account key, or OIDC in the browser. The Talos screens are hidden; every Kubernetes screen, background alerts and data services are there, and what you may do is your RBAC.

Is Ichor an official Sidero Labs app?

No. Ichor is an independent, community-built client for Talos Linux. It uses Sidero's open-source Go client library, but it is not made, endorsed or supported by Sidero Labs.

Do I need to install anything on the cluster?

No. Ichor talks to the Talos API that every node already exposes, with a talosconfig, exactly like talosctl. There is no agent, operator or relay server. The Kubernetes screens use the admin kubeconfig Talos issues to an admin certificate, kept in memory only. The network test is the one exception: it starts short-lived netperf pods in a namespace of its own and deletes it when done.

Where does my data go?

Only to your nodes. The app checks GitHub for new releases, and nothing else leaves the phone unless you turn it on. AI diagnosis is off by default, shows you the exact report first, and sends it only when you tap Ask, with names and addresses hidden if you choose. Downloading logos for apps beyond the bundled ones is off by default too, and sends only the icon's public name, never your image names.

Can it break my cluster?

Not with a read-only certificate: the Talos API refuses every change. With an operator or admin certificate, risky actions ask you to type the node's hostname, and upgrades are refused when etcd would lose quorum.

How do I move to a new phone?

Back up your clusters and settings from Settings, sealed with a passphrase. On the new phone, tap Restore a backup on the first screen, or, on Android, open the backup file from your file manager. Backups move between Android and iPhone.

Does it handle several clusters?

Yes. Import as many talosconfigs or contexts as you like, switch between them from the header, and give each cluster its own color so you always know where you are.

Your cluster has a pulse. Carry it with you.

Install Ichor in a minute, open the demo, then point it at your own cluster with a read-only certificate. Free, open source, no account.

Support the project

Ichor is free and has no ads or tracking. Drift detection, the incident recorder and every feature on this page are built in the open. If Ichor saves you a trip to the laptop, help fund what comes next through GitHub Sponsors or in crypto.